Steam's wishlist-to-sales %: thoughts & a call for data!
It's the deadly 'waffle and then ask for numbers' combo.
[Hi, I’m Simon Carless, and you’re reading the Game Discoverability Now! newsletter, a regular look at how people find - and buy - your video games. Or don’t.]

After the last - slightly lighter, fluffier - newsletter, we’re back to hard data land. And I’m focusing on a subject that’s important and beloved (?) to many:
‘If you have X wishlists at Steam launch, how many copies of your game will you sell?’
Partly, this newsletter has been prompted by my realization that the quality of Steam wishlists vary more wildly than I ever presumed. (I thought there were ‘slightly bad’ and ‘slightly good’ wishlists. But now I think there’s ‘very bad and ‘very good’ ones.)
So, the sometimes cited - & correctly calculated by Jake Birkett - ‘0.5-ish average sales per wishlist in first week’ isn’t wrong, as such. It’s just… part of a way wider range than many folks think.
More (Anecdotal) Data On Wishlist Outliers
Specifically, since I sent out the last newsletter, I’ve been chatting to someone whose game launched in mid 2019 with almost 20,000 wishlists. However, this game did something similar to the much-discussed WarriOrb, and limped along to around 600 units by the end of the first week (that’s just 0.03 sales per wishlist).
The game doesn’t look bad to me, per se - it’s a pixel-y retro Metroidvania with a publisher. It’s perhaps not a game I would have expected to have 20,000 wishlists at launch, based on my personal experience. (And actually, WarriOrb wasn’t either.)
One thing the dev suggested, based on his comparisons with friends who had better - or similar - wishlist to sales ratios, is simply this.
If almost all of your wishlists are generated internally via Steam, it’s because you’ve had a Steam page for a long time, or you got in an ‘upcoming games’ feature. Those wishlists may be much lower-converting, especially if your off-Steam visibility (community, streamers, etc) is negligible.
But if you have good wishlist numbers and an interested community, streamers already enthusiastic about the game ahead of launch, and press ready to go, then many of your wishlists may be much higher quality - from people genuinely enthused about the game.
You Don’t See What You Can’t See?

Part of the reason I was confused about this was that most of the data I’d seen was from indie publisher No More Robots, which I help out with. And that data has been showing numbers that were - well, way higher.
Of the games NMR has released onto Steam that weren’t Early Access from 2018 to 2020, we’ve had the following results, in randomized order:
Game A: 0.55x sales per wishlist (in first week)
Game B: 0.72x sales per wishlist (in first week)
Game C: 1.19x sales per wishlist (in first week)
Game D: 0.76x sales per wishlist (in first week)
For context, three of these games launched on Steam between 8,000 and 20,000 wishlists. And one of them launched with towards 80,000 wishlists, as NMR supremo Mike Rose revealed on Twitter a little while back.
(Sorry to be a little coy, just for anonymity reasons. Oh, and when discussing this, I always use ‘Wishlist Balance’, not ‘Wishlist Additions’ as the real number. I presume y’all are too. And ‘at launch’ means the day before launch, since wishlists shoot up as soon as the game goes on sale.)
The Answer Was Already In The Data
Now, I freely admit that No More Robots titles are carefully picked to be streamer-friendly, have more established communities, and very robustly promoted by the whole team. So their ‘sales per wishlist’ number was always going to be on the high side.
And, an additional complication - this semi-mythical ‘sales per wishlist’ number, as noted in Jake’s original article, is a compilation of two separate stats - ‘wishlist conversion % in week 1’ and ‘organic sales added in week one’. So it’s possible one of those could be amazing and the other one lousy.
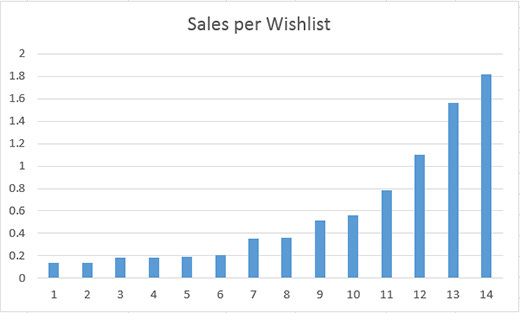
But overall, if you look at Jake’s original graph of the 14 games he got data for, for ‘sales per wishlist’, you’ll see a much bigger range than I previously remembered:

Even though the average is 0.58 sales per wishlist and the median is 0.36, as Jake explicitly notes, the range is from 0.14 sales to 1.8 sales. And six of the fourteen surveyed games are 0.2 sales per wishlist or less, looking at the graph!
That’s a biiig range. Jake’s survey also noted that wishlist conversion % on its own in first week - without organic sales added in - varied between 2% and 32%. That’s another huge range. And things may have changed further since 2018, with thousands more games on Steam.
The Question is - what are your first-week stats?

So, here comes the ask. I’d like to put together an updated 2020 version of the ‘1-week sales per wishlist’ data, completely anonymously, using readers of this newsletter.
I’ve set up a short, completely anonymous questionnaire for you to fill in if you’ve released a game on Steam. Please complete it some time before Friday, May 22nd. I don’t mind if your game sold 500 copies or 500,000 in its first week, we’re just looking for more data here.
There are obviously more variables than we can possibly imagine. And things like ‘being in a hot genre’ or ‘massive YouTubers picking you up after release’ can’t be easily encapsulated in a short survey. (We’ll talk about ‘one year revenue is 4-5x one week revenue’ at another juncture!)
But I feel confident that we can get some useful, current data. And I’ll obviously share all of it with the readers of this newsletter as soon as I get it and numbercrunch it. Thanks in advance! (You can fill it in once for each game, if you have multiple games to share data on.)
Take care,
Simon.
